

How to send alerts from Grafana OSS to Grafana Cloud IRM
In March, we announced that Grafana OnCall (OSS) had entered maintenance mode. However, OnCall’s development continues in Grafana Cloud as Grafana Cloud IRM, combining on-call management and incident response into one integrated solution.
Many users told us they still want to self-host Grafana and rely on Grafana Alerting to detect potential issues early—but they also need to escalate and manage incidents using an incident response management (IRM) solution.
At first glance, it seems like Grafana Cloud services might only work when you’re running Grafana Cloud instances. But here’s the good news: You can connect your self-hosted Grafana (OSS or Enterprise) to Grafana Cloud IRM.
Want to try it yourself? The forever-free plan in Grafana Cloud includes three active IRM users, so you can try it and get started immediately.
Why handle alerts via an IRM solution?
Alerts are the first line of defense in observability. When something’s about to break, your alerting system should do two things:
- Detect that something’s wrong.
- Inform the right people.
Grafana Alerting gives you plenty of options on the notification side. You can send alerts to Slack, Microsoft Teams, email, PagerDuty, Amazon SNS, Jira, webhooks, Grafana Cloud IRM, and many more. We call these channels contact points.
But sending alerts is only half the story.
You need more than a Slack ping when a real incident hits, especially outside working hours. You need structure: clear ownership, escalation paths, on-call schedules, and a process to coordinate your response.
That’s exactly what a solution like Grafana Cloud IRM is designed to provide, with key capabilities to support and structure your team’s processes:
- On-call scheduling: Define rotating shifts, handoffs, and time-based escalation logic.
- Escalation chains: Route alerts based on custom internal policies.
- Multi-channel paging: Notify responders via urgent channels like phone call or mobile app.
- Incident tracking: Tie incidents to your existing alerts and your dashboards.
- Service ownership model: Tie alerts to services, teams, and owners—not just individual users.
- Built-in postmortems: Review timelines, responders, and actions to learn after the incident.
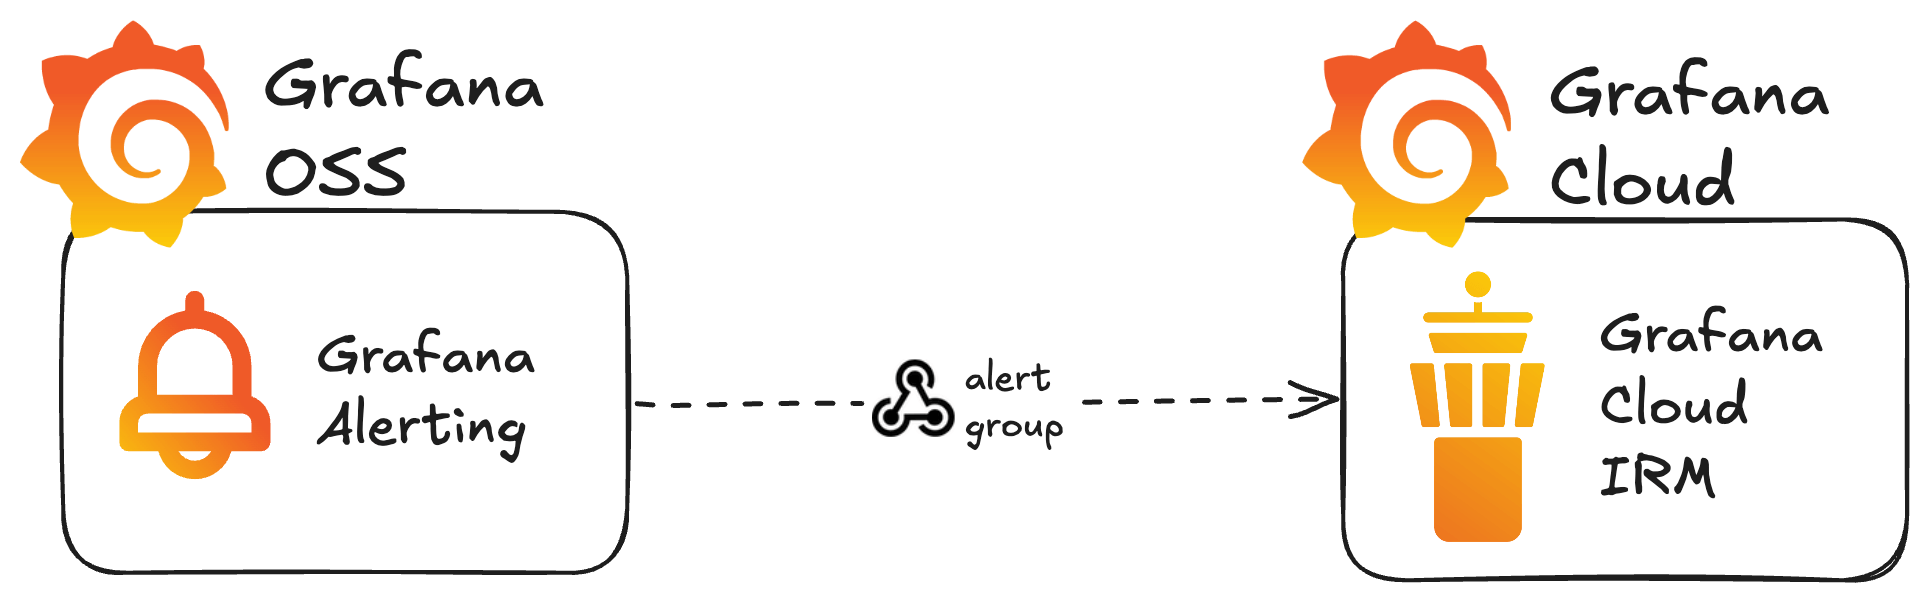
How the integration works
At a high level, Grafana OSS (or Grafana Enterprise) sends alert notifications to Grafana Cloud IRM via a webhook endpoint.
The setup is simple:
- In your Grafana Cloud IRM instance, set up an Alertmanager integration to receive alerts.
- In your hosted Grafana Alerting instance, set up a webhook contact point with the IRM integration endpoint.
This quick video demonstrates the setup and tests the integration:
The integration works out of the box. Grafana Cloud IRM understands the default webhook format used by Grafana Alerting. There’s no need for a custom payload, template, or proxy.
Alerts only flow one way: from your local Grafana into Grafana Cloud IRM, not the other way around. Your dashboards, alert rules, and alert evaluations all remain in your local Grafana instance—you’re just outsourcing incident response to a tool built for it.
Configure the alerts that should page your team
Alerts should indicate a real problem and they should be actionable, but not every alert needs to wake someone up at 3 a.m.
Grafana Cloud IRM offers a lot of flexibility for handling alerts and incidents with escalation chains and routing templates. It also supports two types of notifications—“Default” and “Important”—allowing each IRM user to configure separate notification preferences.
Some of your alerts might relate to transient issues or less critical conditions that don’t require an immediate response. Others signal real production issues that need a coordinated response. Grafana Cloud IRM is built for the latter.
So before you connect everything to Grafana Cloud IRM, take a moment to decide which alert rules should actually page your team. Keeping low-priority alerts out of your escalation chain helps on-call engineers stay focused.
Once you’ve identified which alerts should escalate, there are two ways to forward alerts to Grafana Cloud IRM in Grafana Alerting:
- Select the IRM webhook contact point directly in the alert rule configuration. This is the simplest way to wire a specific rule to your IRM integration.
- Use notification policies to route alerts based on labels like
severity,service, orteam. This option gives you more flexibility and helps scale your alerting setup.
Monitor your incident pipeline with heartbeats
When you run Grafana, it’s easy to assume everything will just work. But what if it doesn’t?
Hosting Grafana comes with some operational overhead, and part of building a reliable observability stack is planning for downtime and hiccups. If your Grafana instance goes down, alert rules can stop running—and you will miss the chance to respond quickly to critical alerts.
Heartbeat monitoring in Grafana Cloud IRM can help with that. You can catch failures in your alerting workflows before your alerts go silent.
It works like this: if Grafana Cloud IRM doesn’t receive any alerts within a defined period, it automatically creates an incident. For instance, the heartbeat expects an alert every 10 minutes, and you create a “dummy” alert that fires every five minutes to fulfill that check.
You’re not monitoring your services here—you’re monitoring the alert-to-incident pipeline itself.
Here’s how to set up heartbeat monitoring:
- In your IRM Alertmanager integration, enable Heartbeat Monitoring.
- Set the expected frequency of incoming alerts (e.g., every five or 10 minutes).
- In your hosted Grafana instance, create an alert rule that fires continuously at shorter intervals than the heartbeat frequency.
For step-by-step instructions and more details, check out the docs.
Wrapping up
Yes, Grafana OSS and Grafana Enterprise work with Grafana Cloud IRM.
Grafana Alerting and Grafana Cloud IRM are complementary solutions—you don’t need to fully migrate to the Cloud to take advantage of Grafana Cloud IRM’s incident response features. Just wire up a webhook integration, route the right alerts, and let Grafana Cloud IRM handle them through custom escalation chains for a coordinated team response.
For full setup details, see the Configure Grafana OSS with Grafana Cloud IRM documentation.
Grafana Cloud is the easiest way to get started with metrics, logs, traces, dashboards, and more. We have a generous forever-free tier and plans for every use case. Sign up for free now!


